Resource Allocation Graph-
| Resource Allocation Graph (RAG) is a graph that represents the state of a system pictorially. |
It gives complete information about the state of a system such as-
- How many processes exist in the system?
- How many instances of each resource type exist?
- How many instances of each resource type are allocated?
- How many instances of each resource type are still available?
- How many instances of each resource type are held by each process?
- How many instances of each resource type does each process need for execution?
Components Of RAG-
There are two major components of a Resource Allocation Graph-
- Vertices
- Edges
Vertices-
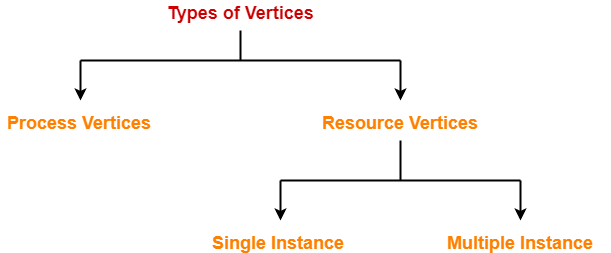
There are following types of vertices in a Resource Allocation Graph-

- Process Vertices
- Resource Vertices
Process Vertices-
- Process vertices represent the processes.
- They are drawn as a circle by mentioning the name of process inside the circle.
Resource Vertices-
- Resource vertices represent the resources.
- Depending on the number of instances that exists in the system, resource vertices may be single instance or multiple instance.
- They are drawn as a rectangle by mentioning the dots inside the rectangle.
- The number of dots inside the rectangle indicates the number of instances of that resource existing in the system.
Edges-
There are two types of edges in a Resource Allocation Graph-

- Assign Edges
- Request Edges
Assign Edges-
- Assign edges represent the assignment of resources to the processes.
- They are drawn as an arrow where the head of the arrow points to the process and tail of the process points to the instance of the resource.
Request Edges-
- Request edges represent the waiting state of processes for the resources.
- They are drawn as an arrow where the head of the arrow points to the instance of the resource and tail of the process points to the process.
- If a process requires ‘n’ instances of a resource type, then ‘n’ assign edges will be drawn.
Example Of RAG-
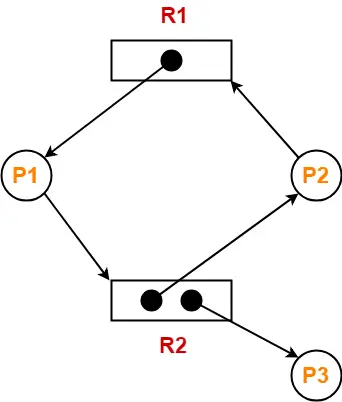
The following diagram represents a Resource Allocation Graph-

It gives the following information-
- There exist three processes in the system namely P1, P2 and P3.
- There exist two resources in the system namely R1 and R2.
- There exists a single instance of resource R1 and two instances of resource R2.
- Process P1 holds one instance of resource R1 and is waiting for an instance of resource R2.
- Process P2 holds one instance of resource R2 and is waiting for an instance of resource R1.
- Process P3 holds one instance of resource R2 and is not waiting for anything.
To gain better understanding about Resource Allocation Graph,
Next Article- Practice Problems On Resource Allocation Graph
Get more notes and other study material of Operating System.
Watch video lectures by visiting our YouTube channel LearnVidFun.
Summary

Article Name
Resource Allocation Graph | Operating System
DescriptionIn OS, Resource Allocation Graph (RAG) is a graph that represents the state of a system pictorially. Whether the system is in a deadlock state or not can be predicted using Resource Allocation Graph.
Author
Akshay Singhal
Publisher Name

Gate Vidyalay
Publisher Logo
