Category: Pattern Recognition

Principal Component Analysis | Dimension Reduction

Dimension Reduction-


In pattern recognition, Dimension Reduction is defined as-

  • It is a process of converting a data set having vast dimensions into a data set with lesser dimensions.
  • It ensures that the converted data set conveys similar information concisely.


Example-


Consider the following example-

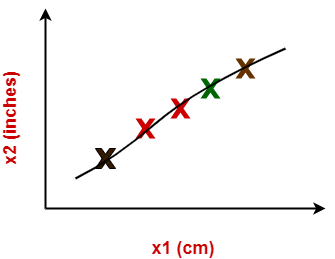
  • The following graph shows two dimensions x1 and x2.
  • x1 represents the measurement of several objects in cm.
  • x2 represents the measurement of several objects in inches.


In machine learning,

  • Using both these dimensions convey similar information.
  • Also, they introduce a lot of noise in the system.
  • So, it is better to use just one dimension.


Using dimension reduction techniques-

  • We convert the dimensions of data from 2 dimensions (x1 and x2) to 1 dimension (z1).
  • It makes the data relatively easier to explain.


Benefits-


Dimension reduction offers several benefits such as-

  • It compresses the data and thus reduces the storage space requirements.
  • It reduces the time required for computation since less dimensions require less computation.
  • It eliminates the redundant features.
  • It improves the model performance.


Dimension Reduction Techniques-


The two popular and well-known dimension reduction techniques are-


  1. Principal Component Analysis (PCA)
  2. Fisher Linear Discriminant Analysis (LDA)


In this article, we will discuss about Principal Component Analysis.


Principal Component Analysis-


  • Principal Component Analysis is a well-known dimension reduction technique.
  • It transforms the variables into a new set of variables called as principal components.
  • These principal components are linear combination of original variables and are orthogonal.
  • The first principal component accounts for most of the possible variation of original data.
  • The second principal component does its best to capture the variance in the data.
  • There can be only two principal components for a two-dimensional data set.


PCA Algorithm-


The steps involved in PCA Algorithm are as follows-


Step-01: Get data.

Step-02: Compute the mean vector (µ).

Step-03: Subtract mean from the given data.

Step-04: Calculate the covariance matrix.

Step-05: Calculate the eigen vectors and eigen values of the covariance matrix.

Step-06: Choosing components and forming a feature vector.

Step-07: Deriving the new data set.


PRACTICE PROBLEMS BASED ON PRINCIPAL COMPONENT ANALYSIS-


Problem-01:


Given data = { 2, 3, 4, 5, 6, 7 ; 1, 5, 3, 6, 7, 8 }.

Compute the principal component using PCA Algorithm.


OR


Consider the two dimensional patterns (2, 1), (3, 5), (4, 3), (5, 6), (6, 7), (7, 8).

Compute the principal component using PCA Algorithm.


OR


Compute the principal component of following data-

CLASS 1

X = 2 , 3 , 4

Y = 1 , 5 , 3

CLASS 2

X = 5 , 6 , 7

Y = 6 , 7 , 8


Solution-


We use the above discussed PCA Algorithm-


Step-01:


Get data.

The given feature vectors are-

  • x1 = (2, 1)
  • x2 = (3, 5)
  • x3 = (4, 3)
  • x4 = (5, 6)
  • x5 = (6, 7)
  • x6 = (7, 8)


Step-02:


Calculate the mean vector (µ).


Mean vector (µ)

= ((2 + 3 + 4 + 5 + 6 + 7) / 6, (1 + 5 + 3 + 6 + 7 + 8) / 6)

= (4.5, 5)


Thus,


Step-03:


Subtract mean vector (µ) from the given feature vectors.

  • x1 – µ = (2 – 4.5, 1 – 5) = (-2.5, -4)
  • x2 – µ = (3 – 4.5, 5 – 5) = (-1.5, 0)
  • x3 – µ = (4 – 4.5, 3 – 5) = (-0.5, -2)
  • x4 – µ = (5 – 4.5, 6 – 5) = (0.5, 1)
  • x5 – µ = (6 – 4.5, 7 – 5) = (1.5, 2)
  • x6 – µ = (7 – 4.5, 8 – 5) = (2.5, 3)


Feature vectors (xi) after subtracting mean vector (µ) are-


Step-04:


Calculate the covariance matrix.

Covariance matrix is given by-


Now,
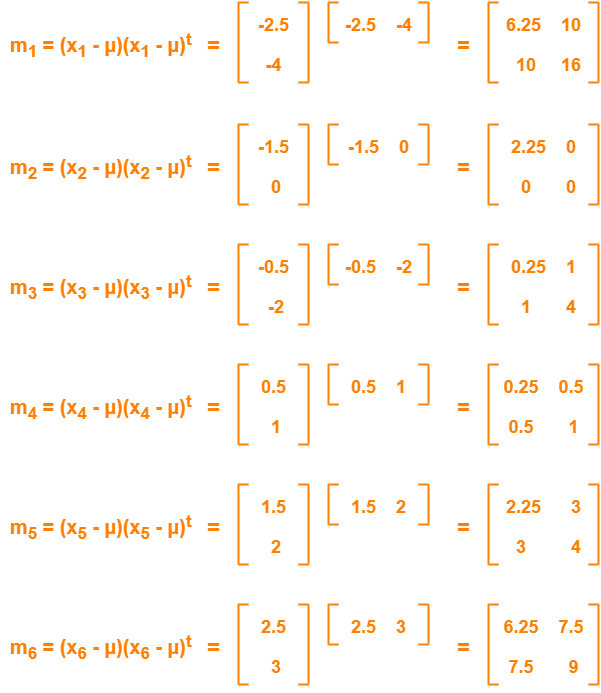


Now,

Covariance matrix

= (m1 + m2 + m3 + m4 + m5 + m6) / 6


On adding the above matrices and dividing by 6, we get-
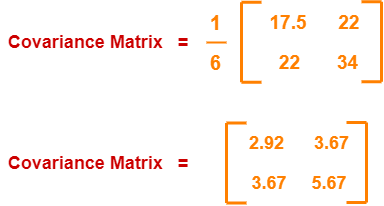


Step-05:


Calculate the eigen values and eigen vectors of the covariance matrix.

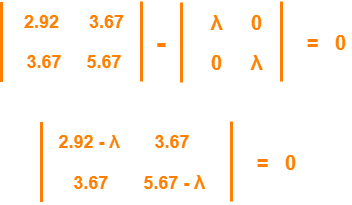
λ is an eigen value for a matrix M if it is a solution of the characteristic equation |M – λI| = 0.

So, we have-


From here,

(2.92 – λ)(5.67 – λ) – (3.67 x 3.67) = 0

16.56 – 2.92λ – 5.67λ + λ2 – 13.47 = 0

λ2 – 8.59λ + 3.09 = 0


Solving this quadratic equation, we get λ = 8.22, 0.38

Thus, two eigen values are λ1 = 8.22 and λ2 = 0.38.


Clearly, the second eigen value is very small compared to the first eigen value.

So, the second eigen vector can be left out.


Eigen vector corresponding to the greatest eigen value is the principal component for the given data set.

So. we find the eigen vector corresponding to eigen value λ1.


We use the following equation to find the eigen vector-

MX = λX

where-

  • M = Covariance Matrix
  • X = Eigen vector
  • λ = Eigen value


Substituting the values in the above equation, we get-


Solving these, we get-

2.92X1 + 3.67X2 = 8.22X1

3.67X1 + 5.67X2 = 8.22X2


On simplification, we get-

5.3X1 = 3.67X2       ………(1)

3.67X1 = 2.55X2     ………(2)


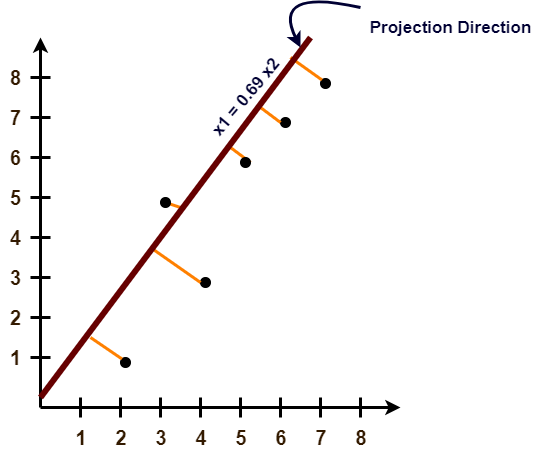
From (1) and (2), X1 = 0.69X2

From (2), the eigen vector is-


Thus, principal component for the given data set is-


Lastly, we project the data points onto the new subspace as-


Problem-02:


Use PCA Algorithm to transform the pattern (2, 1) onto the eigen vector in the previous question.


Solution-


The given feature vector is (2, 1).


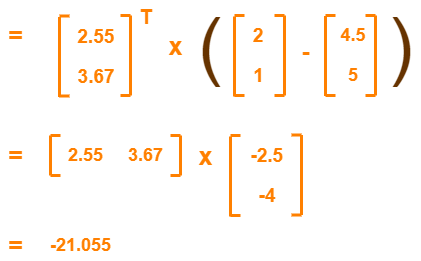
The feature vector gets transformed to

= Transpose of Eigen vector x (Feature Vector – Mean Vector)


To gain better understanding about Principal Component Analysis,

Watch this Video Lecture


Get more notes and other study material of Pattern Recognition.

Watch video lectures by visiting our YouTube channel LearnVidFun.
K-Means Clustering Algorithm | Examples

K-Means Clustering-


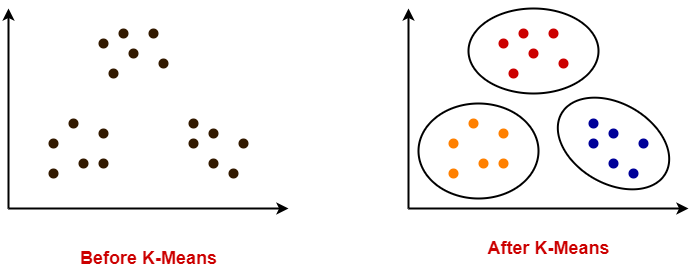
  • K-Means clustering is an unsupervised iterative clustering technique.
  • It partitions the given data set into k predefined distinct clusters.
  • A cluster is defined as a collection of data points exhibiting certain similarities.


It partitions the data set such that-

  • Each data point belongs to a cluster with the nearest mean.
  • Data points belonging to one cluster have high degree of similarity.
  • Data points belonging to different clusters have high degree of dissimilarity.


K-Means Clustering Algorithm-


K-Means Clustering Algorithm involves the following steps-


Step-01:


  • Choose the number of clusters K.


Step-02:


  • Randomly select any K data points as cluster centers.
  • Select cluster centers in such a way that they are as farther as possible from each other.


Step-03:


  • Calculate the distance between each data point and each cluster center.
  • The distance may be calculated either by using given distance function or by using euclidean distance formula.


Step-04:


  • Assign each data point to some cluster.
  • A data point is assigned to that cluster whose center is nearest to that data point.


Step-05:


  • Re-compute the center of newly formed clusters.
  • The center of a cluster is computed by taking mean of all the data points contained in that cluster.


Step-06:


Keep repeating the procedure from Step-03 to Step-05 until any of the following stopping criteria is met-

  • Center of newly formed clusters do not change
  • Data points remain present in the same cluster
  • Maximum number of iterations are reached


Advantages-


K-Means Clustering Algorithm offers the following advantages-


Point-01:


It is relatively efficient with time complexity O(nkt) where-

  • n = number of instances
  • k = number of clusters
  • t = number of iterations


Point-02:


  • It often terminates at local optimum.
  • Techniques such as Simulated Annealing or Genetic Algorithms may be used to find the global optimum.


Disadvantages-


K-Means Clustering Algorithm has the following disadvantages-

  • It requires to specify the number of clusters (k) in advance.
  • It can not handle noisy data and outliers.
  • It is not suitable to identify clusters with non-convex shapes.


PRACTICE PROBLEMS BASED ON K-MEANS CLUSTERING ALGORITHM-


Problem-01:


Cluster the following eight points (with (x, y) representing locations) into three clusters:

A1(2, 10), A2(2, 5), A3(8, 4), A4(5, 8), A5(7, 5), A6(6, 4), A7(1, 2), A8(4, 9)


Initial cluster centers are: A1(2, 10), A4(5, 8) and A7(1, 2).

The distance function between two points a = (x1, y1) and b = (x2, y2) is defined as-

Ρ(a, b) = |x2 – x1| + |y2 – y1|


Use K-Means Algorithm to find the three cluster centers after the second iteration.


Solution-


We follow the above discussed K-Means Clustering Algorithm-


Iteration-01:


  • We calculate the distance of each point from each of the center of the three clusters.
  • The distance is calculated by using the given distance function.


The following illustration shows the calculation of distance between point A1(2, 10) and each of the center of the three clusters-


Calculating Distance Between A1(2, 10) and C1(2, 10)-


Ρ(A1, C1)

= |x2 – x1| + |y2 – y1|

= |2 – 2| + |10 – 10|

= 0


Calculating Distance Between A1(2, 10) and C2(5, 8)-


Ρ(A1, C2)

= |x2 – x1| + |y2 – y1|

= |5 – 2| + |8 – 10|

= 3 + 2

= 5


Calculating Distance Between A1(2, 10) and C3(1, 2)-


Ρ(A1, C3)

= |x2 – x1| + |y2 – y1|

= |1 – 2| + |2 – 10|

= 1 + 8

= 9


In the similar manner, we calculate the distance of other points from each of the center of the three clusters.


Next,

  • We draw a table showing all the results.
  • Using the table, we decide which point belongs to which cluster.
  • The given point belongs to that cluster whose center is nearest to it.


Given Points Distance from center (2, 10) of Cluster-01 Distance from center (5, 8) of Cluster-02 Distance from center (1, 2) of Cluster-03 Point belongs to Cluster
A1(2, 10) 0 5 9 C1
A2(2, 5) 5 6 4 C3
A3(8, 4) 12 7 9 C2
A4(5, 8) 5 0 10 C2
A5(7, 5) 10 5 9 C2
A6(6, 4) 10 5 7 C2
A7(1, 2) 9 10 0 C3
A8(4, 9) 3 2 10 C2


From here, New clusters are-


Cluster-01:


First cluster contains points-

  • A1(2, 10)


Cluster-02:


Second cluster contains points-

  • A3(8, 4)
  • A4(5, 8)
  • A5(7, 5)
  • A6(6, 4)
  • A8(4, 9)


Cluster-03:


Third cluster contains points-

  • A2(2, 5)
  • A7(1, 2)


Now,

  • We re-compute the new cluster clusters.
  • The new cluster center is computed by taking mean of all the points contained in that cluster.


For Cluster-01:


  • We have only one point A1(2, 10) in Cluster-01.
  • So, cluster center remains the same.


For Cluster-02:


Center of Cluster-02

= ((8 + 5 + 7 + 6 + 4)/5, (4 + 8 + 5 + 4 + 9)/5)

= (6, 6)


For Cluster-03:


Center of Cluster-03

= ((2 + 1)/2, (5 + 2)/2)

= (1.5, 3.5)


This is completion of Iteration-01.


Iteration-02:


  • We calculate the distance of each point from each of the center of the three clusters.
  • The distance is calculated by using the given distance function.


The following illustration shows the calculation of distance between point A1(2, 10) and each of the center of the three clusters-


Calculating Distance Between A1(2, 10) and C1(2, 10)-


Ρ(A1, C1)

= |x2 – x1| + |y2 – y1|

= |2 – 2| + |10 – 10|

= 0


Calculating Distance Between A1(2, 10) and C2(6, 6)-


Ρ(A1, C2)

= |x2 – x1| + |y2 – y1|

= |6 – 2| + |6 – 10|

= 4 + 4

= 8


Calculating Distance Between A1(2, 10) and C3(1.5, 3.5)-


Ρ(A1, C3)

= |x2 – x1| + |y2 – y1|

= |1.5 – 2| + |3.5 – 10|

= 0.5 + 6.5

= 7


In the similar manner, we calculate the distance of other points from each of the center of the three clusters.


Next,

  • We draw a table showing all the results.
  • Using the table, we decide which point belongs to which cluster.
  • The given point belongs to that cluster whose center is nearest to it.


Given Points Distance from center (2, 10) of Cluster-01 Distance from center (6, 6) of Cluster-02 Distance from center (1.5, 3.5) of Cluster-03 Point belongs to Cluster
A1(2, 10) 0 8 7 C1
A2(2, 5) 5 5 2 C3
A3(8, 4) 12 4 7 C2
A4(5, 8) 5 3 8 C2
A5(7, 5) 10 2 7 C2
A6(6, 4) 10 2 5 C2
A7(1, 2) 9 9 2 C3
A8(4, 9) 3 5 8 C1


From here, New clusters are-


Cluster-01:


First cluster contains points-

  • A1(2, 10)
  • A8(4, 9)


Cluster-02:


Second cluster contains points-

  • A3(8, 4)
  • A4(5, 8)
  • A5(7, 5)
  • A6(6, 4)


Cluster-03:


Third cluster contains points-

  • A2(2, 5)
  • A7(1, 2)


Now,

  • We re-compute the new cluster clusters.
  • The new cluster center is computed by taking mean of all the points contained in that cluster.


For Cluster-01:


Center of Cluster-01

= ((2 + 4)/2, (10 + 9)/2)

= (3, 9.5)


For Cluster-02:


Center of Cluster-02

= ((8 + 5 + 7 + 6)/4, (4 + 8 + 5 + 4)/4)

= (6.5, 5.25)


For Cluster-03:


Center of Cluster-03

= ((2 + 1)/2, (5 + 2)/2)

= (1.5, 3.5)


This is completion of Iteration-02.


After second iteration, the center of the three clusters are-

  • C1(3, 9.5)
  • C2(6.5, 5.25)
  • C3(1.5, 3.5)


Problem-02:


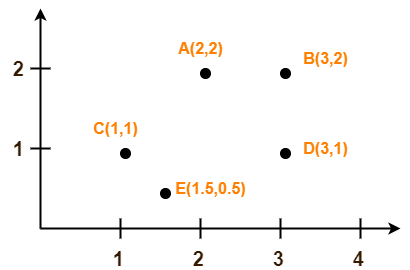
Use K-Means Algorithm to create two clusters-


Solution-


We follow the above discussed K-Means Clustering Algorithm.

Assume A(2, 2) and C(1, 1) are centers of the two clusters.


Iteration-01:


  • We calculate the distance of each point from each of the center of the two clusters.
  • The distance is calculated by using the euclidean distance formula.


The following illustration shows the calculation of distance between point A(2, 2) and each of the center of the two clusters-


Calculating Distance Between A(2, 2) and C1(2, 2)-


Ρ(A, C1)

= sqrt [ (x2 – x1)2 + (y2 – y1)2 ]

= sqrt [ (2 – 2)2 + (2 – 2)2 ]

= sqrt [ 0 + 0 ]

= 0


Calculating Distance Between A(2, 2) and C2(1, 1)-


Ρ(A, C2)

= sqrt [ (x2 – x1)2 + (y2 – y1)2 ]

= sqrt [ (1 – 2)2 + (1 – 2)2 ]

= sqrt [ 1 + 1 ]

= sqrt [ 2 ]

= 1.41


In the similar manner, we calculate the distance of other points from each of the center of the two clusters.


Next,

  • We draw a table showing all the results.
  • Using the table, we decide which point belongs to which cluster.
  • The given point belongs to that cluster whose center is nearest to it.


Given Points Distance from center (2, 2) of Cluster-01 Distance from center (1, 1) of Cluster-02 Point belongs to Cluster
A(2, 2) 0 1.41 C1
B(3, 2) 1 2.24 C1
C(1, 1) 1.41 0 C2
D(3, 1) 1.41 2 C1
E(1.5, 0.5) 1.58 0.71 C2


From here, New clusters are-


Cluster-01:


First cluster contains points-

  • A(2, 2)
  • B(3, 2)
  • E(1.5, 0.5)
  • D(3, 1)


Cluster-02:


Second cluster contains points-

  • C(1, 1)
  • E(1.5, 0.5)


Now,

  • We re-compute the new cluster clusters.
  • The new cluster center is computed by taking mean of all the points contained in that cluster.


For Cluster-01:


Center of Cluster-01

= ((2 + 3 + 3)/3, (2 + 2 + 1)/3)

= (2.67, 1.67)


For Cluster-02:


Center of Cluster-02

= ((1 + 1.5)/2, (1 + 0.5)/2)

= (1.25, 0.75)


This is completion of Iteration-01.

Next, we go to iteration-02, iteration-03 and so on until the centers do not change anymore.


To gain better understanding about K-Means Clustering Algorithm,

Watch this Video Lecture


Next Article- Principal Component Analysis


Get more notes and other study material of Pattern Recognition.

Watch video lectures by visiting our YouTube channel LearnVidFun.