Category: Operating System

Deadlock Detection | Deadlock Prevention

Deadlock Handling-


Before you go through this article, make sure that you have gone through the previous article on Deadlock in OS.


The various strategies for handling deadlock are-


  1. Deadlock Prevention
  2. Deadlock Avoidance
  3. Deadlock Detection and Recovery
  4. Deadlock Ignorance


Deadlock Prevention-


  • This strategy involves designing a system that violates one of the four necessary conditions required for the occurrence of deadlock.
  • This ensures that the system remains free from the deadlock.


The various conditions of deadlock occurrence may be violated as-


1. Mutual Exclusion-


  • To violate this condition, all the system resources must be such that they can be used in a shareable mode.
  • In a system, there are always some resources which are mutually exclusive by nature.
  • So, this condition can not be violated.


2. Hold and Wait-


This condition can be violated in the following ways-


Approach-01:


In this approach,

  • A process has to first request for all the resources it requires for execution.
  • Once it has acquired all the resources, only then it can start its execution.
  • This approach ensures that the process does not hold some resources and wait for other resources.


Drawbacks-


The drawbacks of this approach are-

  • It is less efficient.
  • It is not implementable since it is not possible to predict in advance which resources will be required during execution.


Approach-02:


In this approach,

  • A process is allowed to acquire the resources it desires at the current moment.
  • After acquiring the resources, it start its execution.
  • Now before making any new request, it has to compulsorily release all the resources that it holds currently.
  • This approach is efficient and implementable.


Approach-03:


In this approach,

  • A timer is set after the process acquires any resource.
  • After the timer expires, a process has to compulsorily release the resource.


3. No Preemption-


  • This condition can by violated by forceful preemption.
  • Consider a process is holding some resources and request other resources that can not be immediately allocated to it.
  • Then, by forcefully preempting the currently held resources, the condition can be violated.


A process is allowed to forcefully preempt the resources possessed by some other process only if-

  • It is a high priority process or a system process.
  • The victim process is in the waiting state.


4. Circular Wait-


  • This condition can be violated by not allowing the processes to wait for resources in a cyclic manner.
  • To violate this condition, the following approach is followed-


Approach-


  • A natural number is assigned to every resource.
  • Each process is allowed to request for the resources either in only increasing or only decreasing order of the resource number.
  • In case increasing order is followed, if a process requires a lesser number resource, then it must release all the resources having larger number and vice versa.
  • This approach is the most practical approach and implementable.
  • However, this approach may cause starvation but will never lead to deadlock.


Deadlock Avoidance-


  • This strategy involves maintaining a set of data using which a decision is made whether to entertain the new request or not.
  • If entertaining the new request causes the system to move in an unsafe state, then it is discarded.
  • This strategy requires that every process declares its maximum requirement of each resource type in the beginning.
  • The main challenge with this approach is predicting the requirement of the processes before execution.
  • Banker’s Algorithm is an example of a deadlock avoidance strategy.


Deadlock Detection and Recovery-


  • This strategy involves waiting until a deadlock occurs.
  • After deadlock occurs, the system state is recovered.
  • The main challenge with this approach is detecting the deadlock.


Deadlock Ignorance-


  • This strategy involves ignoring the concept of deadlock and assuming as if it does not exist.
  • This strategy helps to avoid the extra overhead of handling deadlock.
  • Windows and Linux use this strategy and it is the most widely used method.
  • It is also called as Ostrich approach.


To gain better understanding about Deadlock Handling Strategies,

Watch this Video Lecture


Next Article- Practice Problems On Deadlock


Get more notes and other study material of Operating System.

Watch video lectures by visiting our YouTube channel LearnVidFun.
Deadlock in OS | Conditions for Deadlock

Deadlock in OS-


Deadlock is a situation where-

  • The execution of two or more processes is blocked because each process holds some resource and waits for another resource held by some other process.


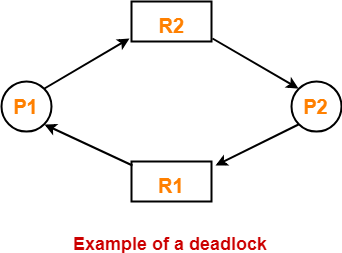
Example-


Here

  • Process P1 holds resource R1 and waits for resource R2 which is held by process P2.
  • Process P2 holds resource R2 and waits for resource R1 which is held by process P1.
  • None of the two processes can complete and release their resource.
  • Thus, both the processes keep waiting infinitely.


Conditions For Deadlock-


There are following 4 necessary conditions for the occurrence of deadlock-

  1. Mutual Exclusion
  2. Hold and Wait
  3. No preemption
  4. Circular wait


1. Mutual Exclusion-


By this condition,

  • There must exist at least one resource in the system which can be used by only one process at a time.
  • If there exists no such resource, then deadlock will never occur.
  • Printer is an example of a resource that can be used by only one process at a time.


2. Hold and Wait-


By this condition,

  • There must exist a process which holds some resource and waits for another resource held by some other process.


3. No Preemption-


By this condition,

  • Once the resource has been allocated to the process, it can not be preempted.
  • It means resource can not be snatched forcefully from one process and given to the other process.
  • The process must release the resource voluntarily by itself.


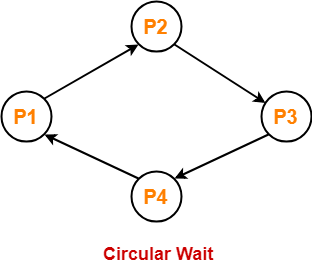
4. Circular Wait-


By this condition,

  • All the processes must wait for the resource in a cyclic manner where the last process waits for the resource held by the first process.


Here,

  • Process P1 waits for a resource held by process P2.
  • Process P2 waits for a resource held by process P3.
  • Process P3 waits for a resource held by process P4.
  • Process P4 waits for a resource held by process P1.


Important Note-


  • All these 4 conditions must hold simultaneously for the occurrence of deadlock.
  • If any of these conditions fail, then the system can be ensured deadlock free.


To gain better understanding about Deadlock in OS,

Watch this Video Lecture


Next Article- Deadlock Handling Strategies


Get more notes and other study material of Operating System.

Watch video lectures by visiting our YouTube channel LearnVidFun.
HRRN Scheduling | CPU Scheduling

HRRN Scheduling-


In HRRN Scheduling,

  • Out of all the available processes, CPU is assigned to the process having highest response ratio.
  • In case of a tie, it is broken by FCFS Scheduling.
  • It operates only in non-preemptive mode.


Calculating Response Ratio-


Response Ratio (RR) for any process is calculated by using the formula-


where-

  • W = Waiting time of the process so far
  • B = Burst time or Service time of the process


Advantages-


  • It performs better than SJF Scheduling.
  • It not only favors the shorter jobs but also limits the waiting time of longer jobs.


Disadvantages-


  • It can not be implemented practically.
  • This is because burst time of the processes can not be known in advance.


PRACTICE PROBLEM BASED ON HRRN SCHEDULING-


Problem-


Consider the set of 5 processes whose arrival time and burst time are given below-


Process Id Arrival time Burst time
P0 0 3
P1 2 6
P2 4 4
P3 6 5
P4 8 2


If the CPU scheduling policy is Highest Response Ratio Next, calculate the average waiting time and average turn around time.


Solution-


Step-01:


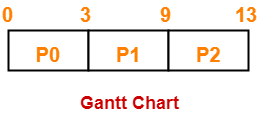
  • At t = 0, only the process P0 is available in the ready queue.
  • So, process P0 executes till its completion.


Step-02:


  • At t = 3, only the process P1 is available in the ready queue.
  • So, process P1 executes till its completion.


Step-03:


  • At t = 9, the processes P2, P3 and P4 are available in the ready queue.
  • The process having the highest response ratio will be executed next.


The response ratio are-

  • Response Ratio for process P2 = [(9-4) + 4] / 4 = 9 / 4 = 2.25
  • Response Ratio for process P3 = [(9-6) + 5] / 5 = 8 / 5 = 1.6
  • Response Ratio for process P4 = [(9-8) + 2] / 2 = 3 / 2 = 1.5


Since process P2 has the highest response ratio, so process P2 executes till completion.


Step-04:


  • At t = 13, the processes P3 and P4 are available in the ready queue.
  • The process having the highest response ratio will be executed next.


The response ratio are calculated as-

  • Response Ratio for process P3 = [(13-6) + 5] / 5 = 12 / 5 = 2.4
  • Response Ratio for process P4 = [(13-8) + 2] / 2 = 7 / 2 = 3.5


Since process P4 has the highest response ratio, so process P4 executes till completion.


Step-05:


  • At t = 15, only the process P3 is available in the ready queue.
  • So, process P3 executes till its completion.


Now, we know-

  • Turn Around time = Exit time – Arrival time
  • Waiting time = Turn Around time – Burst time


Also read- Various Times of Process


Process Id Exit time Turn Around time Waiting time
P0 3 3 – 0 = 3 3 – 3 = 0
P1 9 9 – 2 = 7 7 – 6 = 1
P2 13 13 – 4 = 9 9 – 4 = 5
P3 20 20 – 6 = 14 14 – 5 = 9
P4 15 15 – 8 = 7 7 – 2 = 5


Now,

  • Average Turn Around time = (3 + 7 + 9 + 14 + 7) / 5 = 40 / 5 = 8 units
  • Average waiting time = (0 + 1 + 5 + 9 + 5) / 5 = 20 / 5 = 4 units


To gain better understanding about HRRN Scheduling,

Watch this Video Lecture


Next Article- Round Robin Scheduling


Get more notes and other study material of Operating System.

Watch video lectures by visiting our YouTube channel LearnVidFun.

Predicting Burst Time | SJF Scheduling

SJF Scheduling-


Before you go through this article, make sure that you have gone through the previous article on SJF Scheduling.


In SJF Scheduling,

  • Out of all the available processes, CPU is assigned to the process having smallest burst time.
  • The main drawback of SJF Scheduling is that it can not be implemented practically.
  • This is because burst time of the processes can not be known in advance.


In this article, we will discuss techniques to predict burst time.


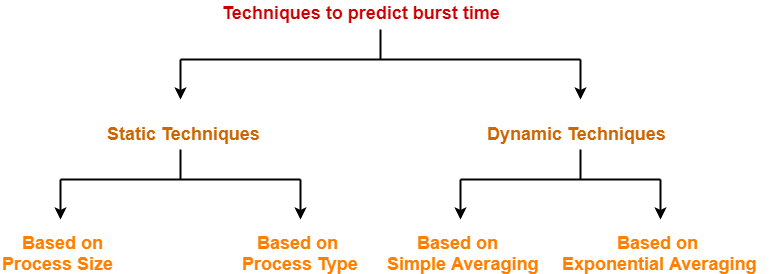
Techniques to Predict Burst Time-


There are several techniques which try to predict the burst time for the processes so that the algorithm can be implemented.

These techniques are-


Static Techniques-


There are two static techniques-

  1. Based on process size
  2. Based on process type


1. Based on Process Size-


  • This technique predicts the burst time for a process based on its size.
  • Burst time of the already executed process of similar size is taken as the burst time for the process to be executed.


Example-


  • Consider a process of size 200 KB took 20 units of time to complete its execution.
  • Then, burst time for any future process having size around 200 KB can be taken as 20 units.


NOTE

  • The predicted burst time may not always be right.
  • This is because the burst time of a process also depends on what kind of a process it is.


2. Based on Process Type-


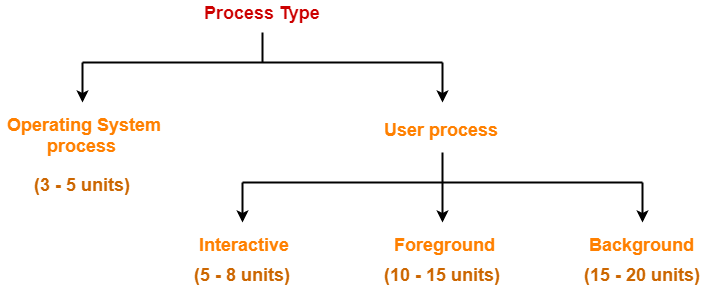
  • This technique predicts the burst time for a process based on its type.
  • The following figure shows the burst time assumed for several kinds of processes.


Dynamic Techniques-


There are two dynamic techniques-

  1. Based on simple averaging
  2. Based on exponential averaging


1. Based on Simple Averaging-


  • Burst time for the process to be executed is taken as the average of all the processes that are executed till now.
  • Given n processes P1, P2, … , Pn and burst time of each process Pi as ti, then predicted burst time for process Pn+1 is given as-


2. Based on Exponential Averaging-


  • Given n processes P1, P2, … , Pn and burst time of each process Pi as ti. Then, predicted burst time for process Pn+1 is given as-


where-

  • α is called smoothening factor (0<= α <=1)
  • tn = actual burst time of process Pn
  • Tn = Predicted burst time for process Pn


PRACTICE PROBLEM BASED ON PREDICTING BURST TIME-


Problem-


Calculate the predicted burst time using exponential averaging for the fifth process if the predicted burst time for the first process is 10 units and actual burst time of the first four processes is 4, 8, 6 and 7 units respectively. Given α = 0.5.


Solution-


Given-

  • Predicted burst time for 1st process = 10 units
  • Actual burst time of the first four processes = 4, 8, 6, 7
  • α = 0.5


Predicted Burst Time for 2nd Process-


Predicted burst time for 2nd process

= α x Actual burst time of 1st process + (1-α) x Predicted burst time for 1st process

= 0.5 x 4 + 0.5 x 10

= 2 + 5

= 7 units


Predicted Burst Time for 3rd Process-


Predicted burst time for 3rd process

= α x Actual burst time of 2nd process + (1-α) x Predicted burst time for 2nd process

= 0.5 x 8 + 0.5 x 7

= 4 + 3.5

= 7.5 units


Predicted Burst Time for 4th Process-


Predicted burst time for 4th process

= α x Actual burst time of 3rd process + (1-α) x Predicted burst time for 3rd process

= 0.5 x 6 + 0.5 x 7.5

= 3 + 3.75

= 6.75 units


Predicted Burst Time for 5th Process-


Predicted burst time for 5th process

= α x Actual burst time of 4th process + (1-α) x Predicted burst time for 4th process

= 0.5 x 7 + 0.5 x 6.75

= 3.5 + 3.375

= 6.875 units


To gain better understanding about predicting burst time,

Watch this Video Lecture


Next Article- LJF Scheduling | LRTF Scheduling


Get more notes and other study material of Operating System.

Watch video lectures by visiting our YouTube channel LearnVidFun.

Longest Job First Algorithm | LRTF Scheduling

Longest Job First Algorithm-


In LJF Scheduling,

  • Out of all the available processes, CPU is assigned to the process having largest burst time.
  • In case of a tie, it is broken by FCFS Scheduling.


  • LJF Scheduling can be used in both preemptive and non-preemptive mode.
  • Preemptive mode of Longest Job First is called as Longest Remaining Time First (LRTF).


Advantages-


  • No process can complete until the longest job also reaches its completion.
  • All the processes approximately finishes at the same time.


Disadvantages-


  • The waiting time is high.
  • Processes with smaller burst time may starve for CPU.


PRACTICE PROBLEMS BASED ON LJF SCHEDULING-


Problem-01:


Consider the set of 5 processes whose arrival time and burst time are given below-


Process Id Arrival time Burst time
P1 0 3
P2 1 2
P3 2 4
P4 3 5
P5 4 6


If the CPU scheduling policy is LJF non-preemptive, calculate the average waiting time and average turn around time.


Solution-


Gantt Chart-


Now, we know-

  • Turn Around time = Exit time – Arrival time
  • Waiting time = Turn Around time – Burst time


Also read- Various Times of Process


Process Id Exit time Turn Around time Waiting time
P1 3 3 – 0 = 3 3 – 3 = 0
P2 20 20 – 1 = 19 19 – 2 = 17
P3 18 18 – 2 = 16 16 – 4 = 12
P4 8 8 – 3 = 5 5 – 5 = 0
P5 14 14 – 4 = 10 10 – 6 = 4


Now,

  • Average Turn Around time = (3 + 19 + 16 + 5 + 10) / 5 = 53 / 5 = 10.6 unit
  • Average waiting time = (0 + 17 + 12 + 0 + 4) / 5 = 33 / 5 = 6.6 unit


Problem-02:


Consider the set of 4 processes whose arrival time and burst time are given below-


Process Id Arrival time Burst time
P1 1 2
P2 2 4
P3 3 6
P4 4 8


If the CPU scheduling policy is LJF preemptive, calculate the average waiting time and average turn around time.


Solution-


Gantt Chart-


Now, we know-

  • Turn Around time = Exit time – Arrival time
  • Waiting time = Turn Around time – Burst time


Process Id Exit time Turn Around time Waiting time
P1 18 18 – 1 = 17 17 – 2 = 15
P2 19 19 – 2 = 17 17 – 4 = 13
P3 20 20 – 3 = 17 17 – 6 = 11
P4 21 21 – 4 = 17 17 – 8 = 9


Now,

  • Average Turn Around time = (17 + 17 + 17 + 17) / 4 = 68 / 4 = 17 unit
  • Average waiting time = (15 + 13 + 11 + 9) / 4 = 48 / 4 = 12 unit


Problem-03:


Consider three processes (process id 0, 1, 2 respectively) with compute time bursts 2, 4 and 8 time units. All processes arrive at time zero. Consider the longest remaining time first (LRTF) scheduling algorithm. In LRTF, ties are broken by giving priority to the process with the lowest process id. The average turn around time is-

  1. 13 unit
  2. 14 unit
  3. 15 unit
  4. 16 unit


Solution-


We have the set of 3 processes whose arrival time and burst time are given below-


Process Id Arrival time Burst time
P1 0 2
P2 0 4
P3 0 8


Gantt Chart-


Now, we know-

Turn Around time = Exit time – Arrival time


Process Id Exit time Turn Around time
P1 12 12 – 0 = 12
P2 13 13 – 0 = 13
P3 24 14 – 0 = 14


Now,

Average Turn Around time = (12 + 13 + 14) / 3 = 39 / 3 = 13 unit

Thus, Option (A) is correct.


To gain better understanding about LJF Scheduling,

Watch this Video Lecture


To gain better understanding about LRTF Scheduling,

Watch this Video Lecture


Next Article- Highest Response Ratio Next Scheduling


Get more notes and other study material of Operating System.

Watch video lectures by visiting our YouTube channel LearnVidFun.