Category: Computer Networks

Go back N | Sliding Window Protocol

Sliding Window Protocol-


Before you go through this article, make sure that you have gone through the previous article on Sliding Window Protocol.


The two well known implementations of sliding window protocol are-


  1. Go back N Protocol
  2. Selective Repeat Protocol


In this article, we will discuss about Go back N protocol.


Go back N Protocol-


Go back N protocol is an implementation of a sliding window protocol.

The features and working of this protocol are explained in the following points-


Point-01:


In Go back N, sender window size is N and receiver window size is always 1.


In Go back N,

  • Sender window size = N. Example in Go back 10, sender window size will be 10.
  • Receiver window size is always 1 for any value of N.


Point-02:


Go back N uses cumulative acknowledgements.


In Go back N,

  • Receiver maintains an acknowledgement timer.
  • Each time the receiver receives a new frame, it starts a new acknowledgement timer.
  • After the timer expires, receiver sends the cumulative acknowledgement for all the frames that are unacknowledged at that moment.


NOTE-


  • A new acknowledgement timer does not start after the expiry of old acknowledgement timer.
  • It starts after a new frame is received.


Point-03:


Go back N may use independent acknowledgements too.


  • The above point does not mean that Go back N can not use independent acknowledgements.
  • Go back N may use independent acknowledgements too if required.
  • The kind of acknowledgement used depends on the expiry of acknowledgement timer.


Example-


  • Consider after the expiry of acknowledgement timer, there is only one frame left to be acknowledged.
  • Then, Go back N sends the independent acknowledgement for that frame.


Point-04:


Go back N does not accept the corrupted frames and silently discards them.


In Go back N,

  • If receiver receives a frame that is corrupted, then it silently discards that frame.
  • The correct frame is retransmitted by the sender after the time out timer expires.
  • Silently discarding a frame means-

“Simply rejecting the frame and not taking any action”

(like not sending a NACK to the sender to send the correct frame)


Point-05:


Go back N does not accept out of order frames and silently discards them.


In Go back N,

  • If receiver receives a frame whose sequence number is not what the receiver expects, then it silently discards that frame.
  • All the following frames are also discarded.
  • This is because receiver window size is 1 and therefore receiver can not accept out of order frames.


Point-06:


Go back N leads to retransmission of entire window if for any frame, no ACK is received by the sender.


In Go back N,

  • Receiver silently discards the frame if it founds the frame to be either corrupted or out of order.
  • It does not send any acknowledgement for such frame.
  • It silently discards the following frames too.


Thus,

  • If for any particular frame, sender does not receive any acknowledgement, then it understands that along with that frame, all the following frames must also have been discarded by the receiver.
  • So, sender has to retransmit all the following frames too along with that particular frame.
  • Thus, it leads to the retransmission of entire window.
  • That is why, the protocol has been named as “Go back N“.


Point-07:


Go back N leads to retransmission of lost frames after expiry of time out timer.


In Go back N,

  • Consider a frame being sent to the receiver is lost on the way.
  • Then, it is retransmitted only after time out timer expires for that frame at sender’s side.


Efficiency of Go back N-


Efficiency of any flow control protocol is given by-


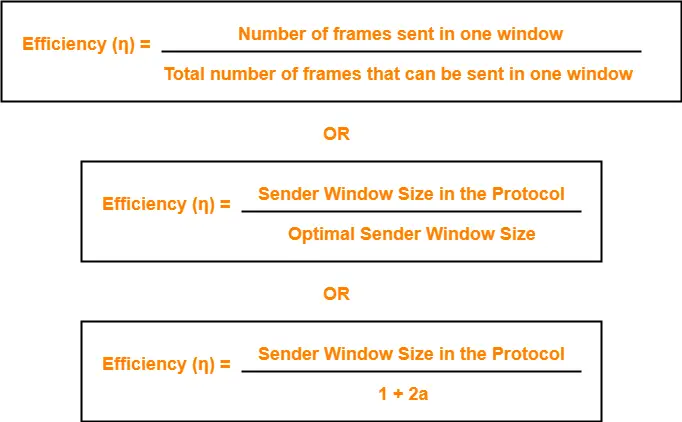
Efficiency = Sender Window Size in Protocol / (1 + 2a)


In Go back N protocol, sender window size = N.

Thus,


Efficiency of Go back N = N / (1 + 2a)


To gain better understanding about Go back N ARQ,

Watch this Video Lecture


Next Article- Practice Problems On Go Back N Protocol


Get more notes and other study material of Computer Networks.

Watch video lectures by visiting our YouTube channel LearnVidFun.

Sliding Window Protocol | Flow Control

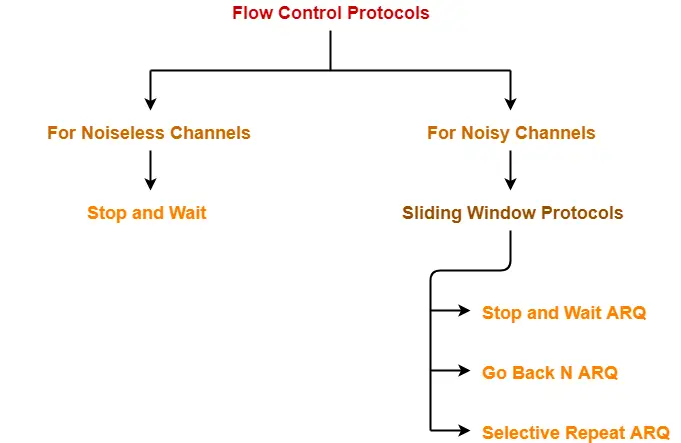
Flow Control Protocols-


In computer networking, there are various flow control protocols-


In this article, we will discuss about sliding window protocol.


Sliding Window Protocol-


  • Sliding window protocol is a flow control protocol.
  • It allows the sender to send multiple frames before needing the acknowledgements.
  • Sender slides its window on receiving the acknowledgements for the sent frames.
  • This allows the sender to send more frames.
  • It is called so because it involves sliding of sender’s window.


Maximum number of frames that sender can send without acknowledgement

= Sender window size


Optimal Window Size-


In a sliding window protocol, optimal sender window size = 1 + 2a


Derivation-


We know,


To get 100% efficiency, we must have-

η = 1

Tt / (Tt + 2Tp) = 1

Tt = Tt + 2Tp


Thus,

  • To get 100% efficiency, transmission time must be Tt + 2Tinstead of Tt.
  • This means sender must send the frames in waiting time too.
  • Now, let us find the maximum number of frames that can be sent in time Tt + 2Tp.


We have-

  • In time Tt, sender sends one frame.
  • Thus, In time Tt + 2Tp, sender can send (Tt + 2Tp) / Tt frames i.e. 1+2a frames.


Thus, to achieve 100% efficiency, window size of the sender must be 1+2a.


Required Sequence Numbers-


  • Each sending frame has to be given a unique sequence number.
  • Maximum number of frames that can be sent in a window = 1+2a.
  • So, minimum number of sequence numbers required = 1+2a.


To have 1+2a sequence numbers,

Minimum number of bits required in sequence number field = ⌈log2(1+2a)⌉


NOTE-


  • When minimum number of bits is asked, we take the ceil.
  • When maximum number of bits is asked, we take the floor.


Choosing a Window Size-


The size of the sender’s window is bounded by-


1. Receiver’s Ability-


  • Receiver’s ability to process the data bounds the sender window size.
  • If receiver can not process the data fast, sender has to slow down and not transmit the frames too fast.


2. Sequence Number Field-


  • Number of bits available in the sequence number field also bounds the sender window size.
  • If sequence number field contains n bits, then 2n sequence numbers are possible.
  • Thus, maximum number of frames that can be sent in one window = 2n.


For n bits in sequence number field, Sender Window Size = min (1+2a , 2n)


Implementations of Sliding Window Protocol-


The two well known implementations of sliding window protocol are-


  1. Go back N Protocol
  2. Selective Repeat Protocol


Efficiency-


Efficiency of any flow control protocol may be expressed as-


Example-


In Stop and Wait ARQ, sender window size = 1.

Thus,

Efficiency of Stop and Wait ARQ = 1 / 1+2a


PRACTICE PROBLEMS BASED ON SLIDING WINDOW PROTOCOL-


Problem-01:


If transmission delay and propagation delay in a sliding window protocol are 1 msec and 49.5 msec respectively, then-

  1. What should be the sender window size to get the maximum efficiency?
  2. What is the minimum number of bits required in the sequence number field?
  3. If only 6 bits are reserved for sequence numbers, then what will be the efficiency?


Solution-


Given-

  • Transmission delay = 1 msec
  • Propagation delay = 49.5 msec


Part-01:


To get the maximum efficiency, sender window size

= 1 + 2a

= 1 + 2 x (Tp / Tt)

= 1 + 2 x (49.5 msec / 1 msec)

= 1 + 2 x 49.5

= 100

Thus,

For maximum efficiency, sender window size = 100


Part-02:


Minimum number of bits required in the sequence number field

= ⌈log2(1+2a)⌉

= ⌈log2(100)⌉

= ⌈6.8⌉

= 7

Thus,

Minimum number of bits required in the sequence number field = 7


Part-03:


If only 6 bits are reserved in the sequence number field, then-

Maximum sequence numbers possible = 26 = 64

Now,

Efficiency

= Sender window size in the protocol / Optimal sender window size

= 64 / 100

= 0.64

= 64%


Problem-02:


If transmission delay and propagation delay in a sliding window protocol are 1 msec and 99.5 msec respectively, then-

  1. What should be the sender window size to get the maximum efficiency?
  2. What is the minimum number of bits required in the sequence number field?
  3. If only 7 bits are reserved for sequence numbers, then what will be the efficiency?


Solution-


Given-

  • Transmission delay = 1 msec
  • Propagation delay = 99.5 msec


Part-01:


To get the maximum efficiency, sender window size

= 1 + 2a

= 1 + 2 x (Tp / Tt)

= 1 + 2 x (99.5 msec / 1 msec)

= 1 + 2 x 99.5

= 200

Thus,

For maximum efficiency, sender window size = 200


Part-02:


Minimum number of bits required in the sequence number field

= ⌈log2(1+2a)⌉

= ⌈log2(200)⌉

= ⌈7.64⌉

= 8

Thus,

Minimum number of bits required in the sequence number field = 8


Part-03:


If only 6 bits are reserved in the sequence number field, then-

Maximum sequence numbers possible = 27 = 128

Now,

Efficiency

= Sender window size in the protocol / Optimal sender window size

= 128 / 200

= 0.64

= 64%


To gain better understanding about sliding window protocol,

Watch this Video Lecture


Next Article- Practice Problems On Sliding Window Protocol


Get more notes and other study material of Computer Networks.

Watch video lectures by visiting our YouTube channel LearnVidFun.

Stop and Wait Protocol | Practice Problems

Stop and Wait Protocol-


Before you go through this article, make sure that you have gone through the previous article on Stop and Wait Protocol.


We have discussed-

  • Stop and wait protocol is a simplest flow control protocol.
  • Sender sends a data packet to the receiver and then waits for its acknowledgement.
  • On receiving the acknowledgement, sender sends the next data packet.


Also Read- Stop and Wait ARQ


In this article, we will discuss practice problems based on stop and wait protocol.


PRACTICE PROBLEMS BASED ON STOP AND WAIT PROTOCOL-


Problem-01:


If the bandwidth of the line is 1.5 Mbps, RTT is 45 msec and packet size is 1 KB, then find the link utilization in stop and wait.


Solution-


Given-

  • Bandwidth = 1.5 Mbps
  • RTT = 45 msec
  • Packet size = 1 KB


Calculating Transmission Delay-


Transmission delay (Tt)

= Packet size / Bandwidth

= 1 KB / 1.5 Mbps

= (210 x 8 bits) / (1.5 x 106 bits per sec)

= 5.461 msec


Calculating Propagation Delay-


Propagation delay (Tp)

= Round Trip Time / 2

= 45 msec / 2

= 22.5 msec


Calculating Value Of ‘a’-


a = Tp / Tt

a = 22.5 msec / 5.461 msec

a = 4.12


Calculating Link Utilization-


Link Utilization or Efficiency (η)

= 1 / 1+2a

= 1 / (1 + 2 x 4.12)

= 1 / 9.24

= 0.108

= 10.8 %


Problem-02:


A channel has a bit rate of 4 Kbps and one way propagation delay of 20 msec. The channel uses stop and wait protocol. The transmission time of the acknowledgement frame is negligible. To get a channel efficiency of at least 50%, the minimum frame size should be-

  1. 80 bytes
  2. 80 bits
  3. 160 bytes
  4. 160 bits


Solution-


Given-

  • Bandwidth = 4 Kbps
  • Propagation delay (Tp) = 20 msec
  • Efficiency >= 50%


Let the required frame size = L bits.


Calculating Transmission Delay-


Transmission delay (Tt)

= Packet size / Bandwidth

= L bits / 4 Kbps


Calculating Value Of ‘a’-


a = Tp / Tt

a = 20 msec / ( L bits / 4 Kbps)

a = (20 msec x 4 Kbps) / L bits


Condition For Efficiency To Be At least 50%-


For efficiency to be at least 50%, we must have-

1 / 1+2a >= 1/2

a <= 1/2


Substituting the value of ‘a’, we get-

(20 msec x 4 Kbps) / L bits <= 1/2

L bits >= (20 msec x 4 Kbps) x 2

L bits >= (20 x 10-3 sec x 4 x 103 bits per sec) x 2

L bits >= 20 x 4 bits x 2

L >= 160


From here, frame size must be at least 160 bits.

Thus, Correct Option is (D).


Problem-03:


What is the throughput achievable in stop and wait protocol by a maximum packet size of 1000 bytes and network span of 10 km.

Assume the speed of light in cable is 70% of the speed of light in vaccum.


Solution-


We have-
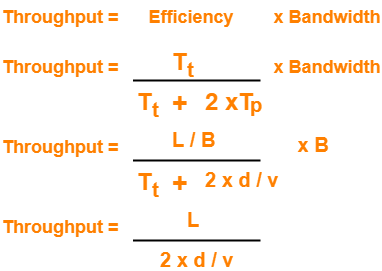
 

  • In the given question, we are not provided with the network’s bandwidth.
  • So, in the above formula of throughput, we have ignored the term Tt from the denominator.
  • Although it is incorrect, but we still ignore it for solving the question.


Now, Given-

  • L = 1000 bytes
  • d = 10 km = 104 m
  • v = 70% of 3 x 10⁸ m/sec = 2.1 x 10⁸ m/sec


Substituting the values in the above relation, we get-

Throughput

= 1000 bytes / [ 2 x 10⁴ m / (2.1 x 10⁸ m/sec)]

= 1.05 x 107 bytes per sec

= 10.5 MBps


Problem-04:


If the packet size is 1 KB and propagation time is 15 msec, the channel capacity is 109 b/sec, then find the transmission time and utilization of sender in stop and wait protocol.


Solution-


Given-

  • Packet size = 1 KB
  • Propagation time (Tp) = 15 msec
  • Channel capacity = Bandwidth (here) = 109 b/sec


NOTE-


  • Generally, channel capacity is the total number of bits which a channel can hold. So, its unit is bits.
  • But here, channel capacity is actually given as bandwidth because its unit is b/sec.


Calculating Transmission Delay-


Transmission delay (Tt)

= Packet size / Bandwidth

= 1 KB / 109 bits per sec

= 210 bits / 109 bits per sec

= 1.024 μsec


Calculating Value Of ‘a’-


a = Tp / Tt

a = 15 msec / 1.024 μsec

a = 15000 μsec / 1.024 μsec

a = 14648.46


Calculating Sender Utilization-


Sender Utilization or Efficiency (η)

= 1 / 1+2a

= 1 / (1 + 2 x 1468.46)

= 1 / 29297.92

= 0.0000341

= 0.00341 %


Problem-05:


Consider a MAN with average source and destination 20 Km apart and one way delay of 100 μsec. At what data rate does the round trip delay equals the transmission delay for a 1 KB packet?


Solution-


Given-

  • Distance = 20 Km
  • Propagation delay (Tp) = 100 μsec
  • Packet size = 1 KB


We need to have-

Round Trip Time = Transmission delay

2 x Propagation delay = Transmission delay


Substituting the values in the above relation, we get-

2 x 100 μsec = 1 KB / Bandwidth

Bandwidth = 1 KB / 200 μsec

Bandwidth = (210 x 106 / 200 ) bytes per sec

Bandwidth = 5.12 MBps or 40.96 Mbps


Problem-06:


Consider two hosts X and Y connected by a single direct link of rate 106 bits/sec. The distance between the two hosts is 10,000 km and the propagation speed along the link is 2 x 10⁸ m/sec. Host X sends a file of 50,000 bytes as one large message to host Y continuously. Let the transmission and propagation delays be p milliseconds and q milliseconds respectively.

Then the value of p and q are-

  1. p = 50 and q = 100
  2. p = 50 and q = 400
  3. p = 100 and q = 50
  4. p = 400 and q = 50


Solution-


Given-

  • Bandwidth = 106 bits/sec
  • Distance = 10,000 km
  • Propagation speed = 2 x 10⁸ m/sec
  • Packet size = 50,000 bytes


Calculating Transmission Delay-


Transmission delay (Tt)

= Packet size / Bandwidth

= 50000 bytes / 106 bits per sec

= (5 x 104 x 8 bits) / 106 bits per sec

= ( 4 x 105 bits ) / 106 bits per sec

= 0.4 sec

= 400 msec


Calculating Propagation Delay-


Propagation delay (Tp)

= Distance / Propagation speed

= 10000 km / (2 x 10⁸ m/sec)

= 107 m / (2 x 10⁸ m/sec)

= 50 msec


Thus, Option (D) is correct.


Problem-07:


The values of parameters for the stop and wait ARQ protocol are as given below-

  • Bit rate of the transmission channel = 1 Mbps
  • Propagation delay from sender to receiver = 0.75 ms
  • Time to process a frame = 0.25 ms
  • Number of bytes in the information frame = 1980
  • Number of bytes in the acknowledge frame = 20
  • Number of overhead bytes in the information frame = 20

Assume that there are no transmission errors. Then the transmission efficiency (in %) of the stop and wait ARQ protocol for the above parameters is ___________ . (correct to 2 decimal places)


Solution-


Given-

  • Bandwidth = 1 Mbps
  • Propagation delay (Tp) = 0.75 ms
  • Processing time (Tprocess) = 0.25 ms
  • Data frame size = 1980 bytes
  • Acknowledgement frame size = 20 bytes
  • Overhead in data frame = 20 bytes


Calculating Useful Time-


Useful data sent

= Transmission delay of useful data bytes sent

= Useful data bytes sent / Bandwidth

= (1980 bytes – 20 bytes) / 1 Mbps

= 1960 bytes / 1 Mbps

= (1960 x 8 bits) / (106 bits per sec)

= 15680 μsec

= 15.680 msec


Calculating Total Time-


Total time

= Transmission delay of data frame + Propagation delay of data frame + Processing delay of data frame + Transmission delay of acknowledgement + Propagation delay of acknowledgement

= (1980 bytes / 1 Mbps) + 0.75 msec + 0.25 msec + (20 bytes / 1 Mbps) + 0.75 msec

= 15.840 msec + 0.75 msec + 0.25 msec + 0.160 msec + 0.75 msec

= 17.75 msec


Calculating Efficiency-


Efficiency (η)

= Useful time / Total time

= 15.680 msec / 17.75 msec

= 0.8833

= 88.33%


Problem-08:


A sender uses the stop and wait ARQ protocol for reliable transmission of frames. Frames are of size  1000 bytes and the transmission rate at the sender is 80 Kbps. Size of an acknowledgement is 100 bytes and the transmission rate at the receiver is 8 Kbps. The one way propagation delay is 100 msec.

Assuming no frame is lost, the sender throughput is __________ bytes/sec.


Solution-


Given-

  • Frame size = 1000 bytes
  • Sender bandwidth = 80 Kbps
  • Acknowledgement size = 100 bytes
  • Receiver bandwidth = 8 Kbps
  • Propagation delay (Tp) = 100 msec


Calculating Transmission Delay Of Data Frame-


Transmission delay (Tt)

= Frame size / Sender bandwidth

= 1000 bytes / 80 Kbps

= (1000 x 8 bits) / (80 x 103 bits per sec)

= 0.1 sec

= 100 msec


Calculating Transmission Delay Of Acknowledgement-


Transmission delay (Tt)

= Acknowledgement size / Receiver bandwidth

= 100 bytes / 8 Kbps

= (100 x 8 bits) / (8 x 103 bits per sec)

= 100 msec


Calculating Useful Time-


Useful Time

= Transmission delay of data frame

= 100 msec


Calculating Total Time-


Total Time

= Transmission delay of data frame + Propagation delay of data frame + Transmission delay of acknowledgement + Propagation delay of acknowledgement

= 100 msec + 100 msec + 100 msec + 100 msec

= 400 msec


Calculating Efficiency-


Efficiency (η)

= Useful time / Total time

= 100 msec / 400 msec

= 1 / 4

= 25%


Calculating Sender Throughput-


Sender throughput

= Efficiency (η) x Sender bandwidth

= 0.25 x 80 Kbps

= 20 Kbps

= (20 x 1000 / 8) bytes per sec

= 2500 bytes/sec


Problem-09:


Using stop and wait protocol, sender wants to transmit 10 data packets to the receiver. Out of these 10 data packets, every 4th data packet is lost. How many packets sender will have to send in total?


Solution-


Draw a time line diagram and analyze.

The packets will be sent as-

1, 2, 3, 4, 4, 5, 6, 7, 7, 8, 9, 10, 10

The lost packets are- 4, 7 and 10.

Thus, sender will have to send 13 data packets in total.


Next Article- Sliding Window Protocol


Get more notes and other study material of Computer Networks.

Watch video lectures by visiting our YouTube channel LearnVidFun.

Distance Vector Routing Algorithm | Example

Routing Algorithms-


  • Routing algorithms are meant for determining the routing of packets in a node.
  • Routing algorithms are classified as-


  1. Static Routing Algorithms
  2. Dynamic Routing Algorithms


In this article, we will discuss about distance vector routing.


Distance Vector Routing Algorithm-


Distance Vector Routing is a dynamic routing algorithm.


It works in the following steps-


Step-01:


Each router prepares its routing table. By their local knowledge. each router knows about-

  • All the routers present in the network
  • Distance to its neighboring routers


Step-02:


  • Each router exchanges its distance vector with its neighboring routers.
  • Each router prepares a new routing table using the distance vectors it has obtained from its neighbors.
  • This step is repeated for (n-2) times if there are n routers in the network.
  • After this, routing tables converge / become stable.


Distance Vector Routing Example-


Consider-

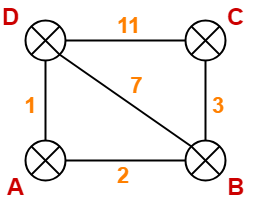
  • There is a network consisting of 4 routers.
  • The weights are mentioned on the edges.
  • Weights could be distances or costs or delays.


Step-01:


Each router prepares its routing table using its local knowledge.

Routing table prepared by each router is shown below-


At Router A-


Destination Distance Next Hop
A 0 A
B 2 B
C
D 1 D


At Router B-


Destination Distance Next Hop
A 2 A
B 0 B
C 3 C
D 7 D


At Router C-


Destination Distance Next Hop
A
B 3 B
C 0 C
D 11 D


At Router D-


Destination Distance Next Hop
A 1 A
B 7 B
C 11 C
D 0 D


Step-02:


  • Each router exchanges its distance vector obtained in Step-01 with its neighbors.
  • After exchanging the distance vectors, each router prepares a new routing table.


This is shown below-


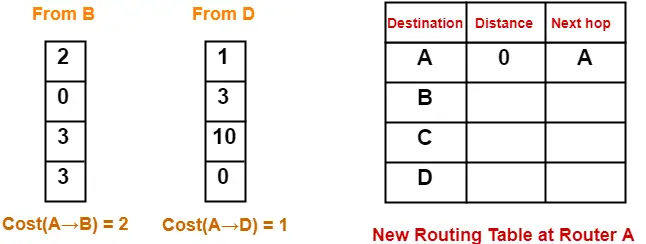
At Router A-


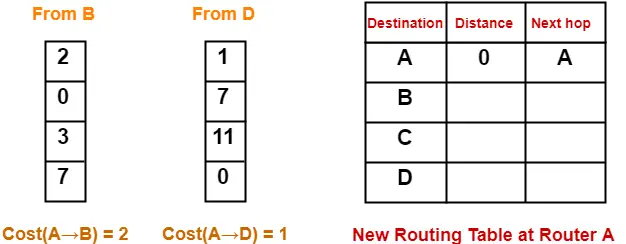
  • Router A receives distance vectors from its neighbors B and D.
  • Router A prepares a new routing table as-


  • Cost of reaching destination B from router A = min { 2+0 , 1+7 } = 2 via B.
  • Cost of reaching destination C from router A = min { 2+3 , 1+11 } = 5 via B.
  • Cost of reaching destination D from router A = min { 2+7 , 1+0 } = 1 via D.


Explanation For Destination B


  • Router A can reach the destination router B via its neighbor B or neighbor D.
  • It chooses the path which gives the minimum cost.
  • Cost of reaching router B from router A via neighbor B = Cost (A→B) + Cost (B→B)= 2 + 0 = 2
  • Cost of reaching router B from router A via neighbor D = Cost (A→D) + Cost (D→B) = 1 + 7 = 8
  • Since the cost is minimum via neighbor B, so router A chooses the path via B.
  • It creates an entry (2, B) for destination B in its new routing table.
  • Similarly, we calculate the shortest path distance to each destination router at every router.


Thus, the new routing table at router A is-


Destination Distance Next Hop
A 0 A
B 2 B
C 5 B
D 1 D


At Router B-


  • Router B receives distance vectors from its neighbors A, C and D.
  • Router B prepares a new routing table as-


  • Cost of reaching destination A from router B = min { 2+0 , 3+∞ , 7+1 } = 2 via A.
  • Cost of reaching destination C from router B = min { 2+∞ , 3+0 , 7+11 } = 3 via C.
  • Cost of reaching destination D from router B = min { 2+1 , 3+11 , 7+0 } = 3 via A.


Thus, the new routing table at router B is-


Destination Distance Next Hop
A 2 A
B 0 B
C 3 C
D 3 A


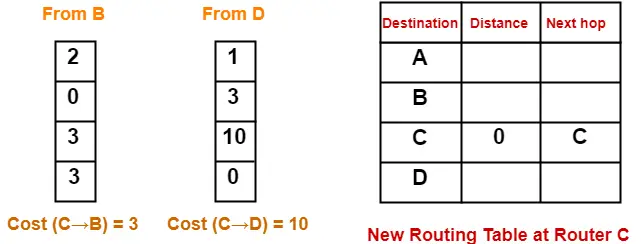
At Router C-


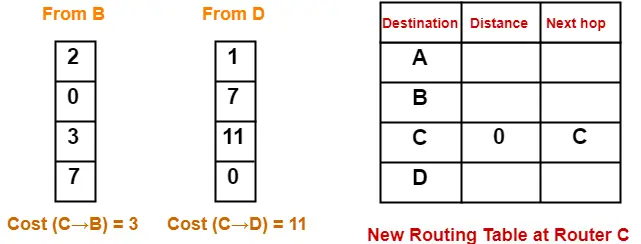
  • Router C receives distance vectors from its neighbors B and D.
  • Router C prepares a new routing table as-


  • Cost of reaching destination A from router C = min { 3+2 , 11+1 } = 5 via B.
  • Cost of reaching destination B from router C = min { 3+0 , 11+7 } = 3 via B.
  • Cost of reaching destination D from router C = min { 3+7 , 11+0 } = 10 via B.


Thus, the new routing table at router C is-


Destination Distance Next Hop
A 5 B
B 3 B
C 0 C
D 10 B


At Router D-


  • Router D receives distance vectors from its neighbors A, B and C.
  • Router D prepares a new routing table as-


  • Cost of reaching destination A from router D = min { 1+0 , 7+2 , 11+∞ } = 1 via A.
  • Cost of reaching destination B from router D = min { 1+2 , 7+0 , 11+3 } = 3 via A.
  • Cost of reaching destination C from router D = min { 1+∞ , 7+3 , 11+0 } = 10 via B.


Thus, the new routing table at router D is-


Destination Distance Next Hop
A 1 A
B 3 A
C 10 B
D 0 D


Step-03:


  • Each router exchanges its distance vector obtained in Step-02 with its neighboring routers.
  • After exchanging the distance vectors, each router prepares a new routing table.


This is shown below-


At Router A-


  • Router A receives distance vectors from its neighbors B and D.
  • Router A prepares a new routing table as-


  • Cost of reaching destination B from router A = min { 2+0 , 1+3 } = 2 via B.
  • Cost of reaching destination C from router A = min { 2+3 , 1+10 } = 5 via B.
  • Cost of reaching destination D from router A = min { 2+3 , 1+0 } = 1 via D.


Thus, the new routing table at router A is-


Destination Distance Next Hop
A 0 A
B 2 B
C 5 B
D 1 D


At Router B-


  • Router B receives distance vectors from its neighbors A, C and D.
  • Router B prepares a new routing table as-


  • Cost of reaching destination A from router B = min { 2+0 , 3+5 , 3+1 } = 2 via A.
  • Cost of reaching destination C from router B = min { 2+5 , 3+0 , 3+10 } = 3 via C.
  • Cost of reaching destination D from router B = min { 2+1 , 3+10 , 3+0 } = 3 via A.


Thus, the new routing table at router B is-


Destination Distance Next Hop
A 2 A
B 0 B
C 3 C
D 3 A


At Router C-


  • Router C receives distance vectors from its neighbors B and D.
  • Router C prepares a new routing table as-


  • Cost of reaching destination A from router C = min { 3+2 , 10+1 } = 5 via B.
  • Cost of reaching destination B from router C = min { 3+0 , 10+3 } = 3 via B.
  • Cost of reaching destination D from router C = min { 3+3 , 10+0 } = 6 via B.


Thus, the new routing table at router C is-


Destination Distance Next Hop
A 5 B
B 3 B
C 0 C
D 6 B


At Router D-


  • Router D receives distance vectors from its neighbors A, B and C.
  • Router D prepares a new routing table as-


  • Cost of reaching destination A from router D = min { 1+0 , 3+2 , 10+5 } = 1 via A.
  • Cost of reaching destination B from router D = min { 1+2 , 3+0 , 10+3 } = 3 via A.
  • Cost of reaching destination C from router D = min { 1+5 , 3+3 , 10+0 } = 6 via A.


Thus, the new routing table at router D is-


Destination Distance Next Hop
A 1 A
B 3 A
C 6 A
D 0 D


These will be the final routing tables at each router.


Identifying Unused Links-


After routing tables converge (becomes stable),

  • Some of the links connecting the routers may never be used.
  • In the above example, we can identify the unused links as-


We have-

  • The value of next hop in the final routing table of router A suggests that only edges AB and AD are used.
  • The value of next hop in the final routing table of router B suggests that only edges BA and BC are used.
  • The value of next hop in the final routing table of router C suggests that only edge CB is used.
  • The value of next hop in the final routing table of router D suggests that only edge DA is used.


Thus, edges  BD and CD are never used.


Important Notes-


Note-01:


In Distance Vector Routing,

  • Only distance vectors are exchanged.
  • “Next hop”values are not exchanged.
  • This is because it results in exchanging the large amount of data which consumes more bandwidth.


Note-02:


While preparing a new routing table-

  • A router takes into consideration only the distance vectors it has obtained from its neighboring routers.
  • It does not take into consideration its old routing table.


Note-03:


The algorithm is called so because-

  • It involves exchanging of distance vectors between the routers.
  • Distance vector is nothing but an array of distances.


Note-04:


  • The algorithm keeps on repeating periodically and never stops.
  • This is to update the shortest path in case any link goes down or topology changes.


Note-05:


  • Routing tables are prepared total (n-1) times if there are n routers in the given network.
  • This is because shortest path between any 2 nodes contains at most n-1 edges if there are n nodes in the graph.


Note-06:


  • Distance Vector Routing suffers from count to infinity problem.
  • Distance Vector Routing uses UDP at transport layer.


Next Article- IP Address | Classes of IP Address


Get more notes and other study material of Computer Networks.

Watch video lectures by visiting our YouTube channel LearnVidFun.
Aloha | Pure Aloha | Slotted Aloha

Access Control in Networking-


Before you go through this article, make sure that you have gone through the previous article on Access Control.


We have discussed-

  • Access Control is a mechanism that controls the access of stations to the transmission link.
  • Broadcast links require the access control mechanism.
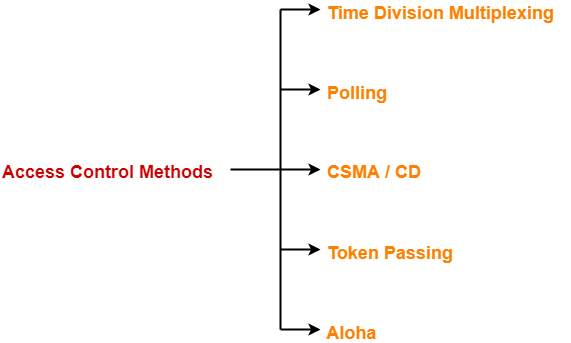
  • There are various access control methods-


  1. Time Division Multiplexing
  2. Polling
  3. CSMA / CD
  4. Token Passing
  5. Aloha


In this article, we will discuss about Aloha and its versions.


Aloha-


There are two different versions of Aloha-


  1. Pure Aloha
  2. Slotted Aloha


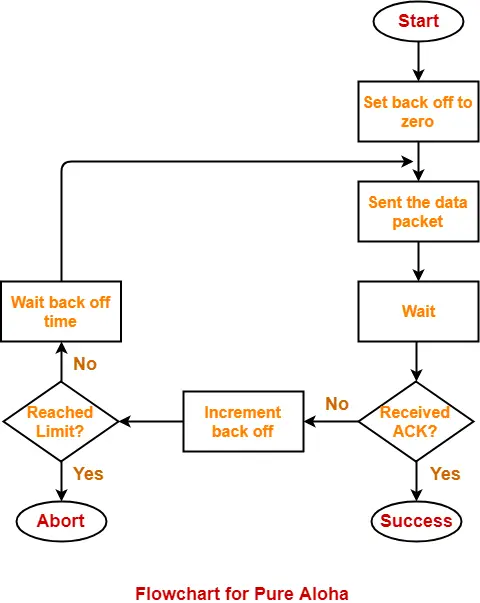
1. Pure Aloha-


  • It allows the stations to transmit data at any time whenever they want.
  • After transmitting the data packet, station waits for some time.


Then, following 2 cases are possible-


Case-01:


  • Transmitting station receives an acknowledgement from the receiving station.
  • In this case, transmitting station assumes that the transmission is successful.


Case-02:


  • Transmitting station does not receive any acknowledgement within specified time from the receiving station.
  • In this case, transmitting station assumes that the transmission is unsuccessful.


Then,

  • Transmitting station uses a Back Off Strategy and waits for some random amount of time.
  • After back off time, it transmits the data packet again.
  • It keeps trying until the back off limit is reached after which it aborts the transmission.


Efficiency-


Efficiency of Pure Aloha (η) = G x e-2G


where G = Number of stations willing to transmit data


Maximum Efficiency-


For maximum efficiency,

  • We put dη / dG = 0
  • Maximum value of η occurs at G = 1/2
  • Substituting G = 1/2 in the above expression, we get-


Maximum efficiency of Pure Aloha

= 1/2 x e-2 x 1/2

= 1 / 2e

= 0.184

= 18.4%


Thus,


Maximum Efficiency of Pure Aloha (η) = 18.4%


The maximum efficiency of Pure Aloha is very less due to large number of collisions.


2. Slotted Aloha-


  • Slotted Aloha divides the time of shared channel into discrete intervals called as time slots.
  • Any station can transmit its data in any time slot.
  • The only condition is that station must start its transmission from the beginning of the time slot.
  • If the beginning of the slot is missed, then station has to wait until the beginning of the next time slot.
  • A collision may occur if two or more stations try to transmit data at the beginning of the same time slot.


Efficiency-


Efficiency of Slotted Aloha (η) = G x e-G


where G = Number of stations willing to transmit data at the beginning of the same time slot


Maximum Efficiency-


For maximum efficiency,

  • We put dη / dG = 0
  • Maximum value of η occurs at G = 1
  • Substituting G = 1 in the above expression, we get-


Maximum efficiency of Slotted Aloha

= 1 x e-1

= 1 / e

= 0.368

= 36.8%


Thus,


Maximum Efficiency of Slotted Aloha (η) = 36.8%


The maximum efficiency of Slotted Aloha is high due to less number of collisions.


Difference Between Pure Aloha And Slotted Aloha-


Pure Aloha Slotted Aloha
Any station can transmit the data at any time. Any station can transmit the data at the beginning of any time slot.
The time is continuous and not globally synchronized. The time is discrete and globally synchronized.
Vulnerable time in which collision may occur

= 2 x Tt

Vulnerable time in which collision may occur

= Tt

Probability of successful transmission of data packet

= G x e-2G

Probability of successful transmission of data packet

= G x e-G

Maximum efficiency = 18.4%

(Occurs at G = 1/2)

Maximum efficiency = 36.8%

( Occurs at G = 1)

The main advantage of pure aloha is its simplicity in implementation. The main advantage of slotted aloha is that it reduces the number of collisions to half and doubles the efficiency of pure aloha.


PRACTICE PROBLEM BASED ON PURE ALOHA AND SLOTTED ALOHA-


Problem-


A group of N stations share 100 Kbps slotted ALOHA channel. Each station output a 500 bits frame on an average of 5000 ms even if previous one has not been sent. What is the required value of N?


Solution-


Throughput Of One Station-


Throughput of each station

= Number of bits sent per second

= 500 bits / 5000 ms

= 500 bits / (5000 x 10-3 sec)

= 100 bits/sec


Throughput Of Slotted Aloha-


Throughput of slotted aloha

= Efficiency x Bandwidth

= 0.368 x 100 Kbps

= 36.8 Kbps


Total Number Of Stations-


Throughput of slotted aloha = Total number of stations x Throughput of each station

Substituting the values, we get-

36.8 Kbps = N x 100 bits/sec

∴ N = 368

Thus, required value of N = 368.


To gain better understanding about Aloha,

Watch this Video Lecture


Next Article- Ethernet | Ethernet Frame Format


Get more notes and other study material of Computer Networks.

Watch video lectures by visiting our YouTube channel LearnVidFun.